▷ How to Create Pivot Tables in Excel
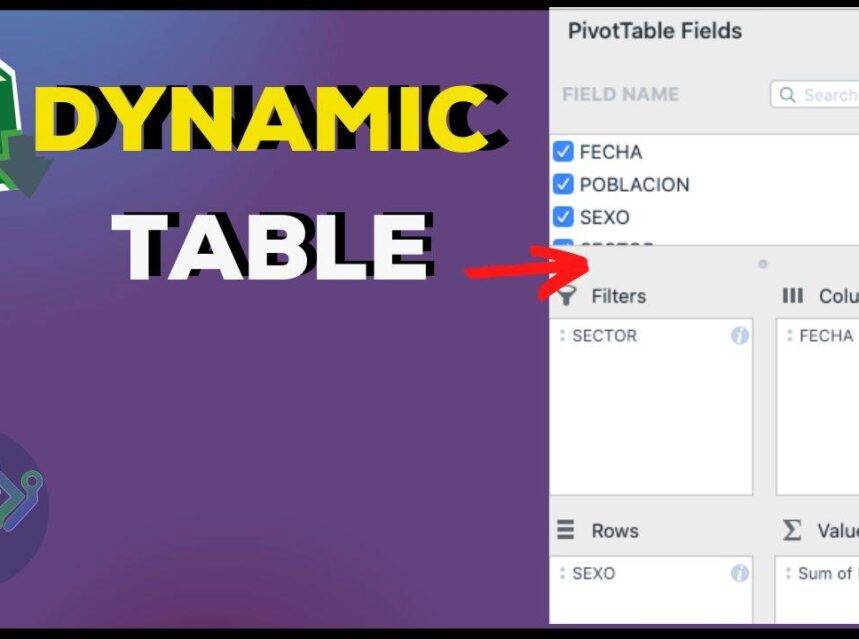
To create pivot tables in excel It is important to know that this is an Excel tool that is widely used to organize, summarize, group, and analyze information quickly and easily, from the options it provides for the list of fields in the pivot table to organize, such as: filters, columns, rows, values.
When you have very extensive information in excel, distributed in several columns and/or rows, data that is repeated and we want to simplify the information, we can use the dynamic tables, even generate graphs with the results of the report.
They can also customize the display of information, changing the font, size, layout of the pivot table and use other options such as "analyze pivot table" to create charts.
The information fields that are the titles of the information contained in the columns are organized in the following areas to be able to create the dynamic tables:
PivotTable Areas:
- FILTERS: This area contains the information that you want to show in the dynamic table and also the one that is excluded.
- COLUMNS: Contains the headers of the table horizontally.
- ROWS: Contains the information that appears vertically in the cells.
- VALUES: Data that are aggregated or have some calculation.
To create a dynamic table, you must have a base information in an excel sheet, this may be contained in a table or not, it must be consistent according to the organization in cells and columns so that when organizing it in the dynamic table it is much more easy.
In this case we are going to use the information on the population in Colombia from 2014 to 2021 as an example:
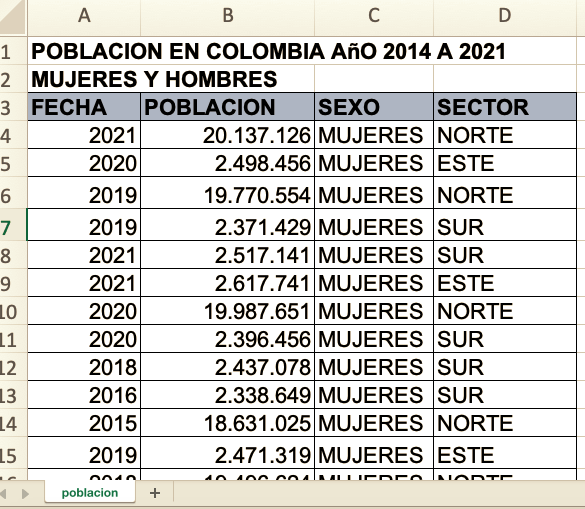
As we can see, the information contained in the date column, gender (Woman/Man) and sector (North, South, East), is repeated to the point that at first glance we cannot analyze, for example, the amount of population at years go by, nor according to the sector of Colombia, how many men or women there are, etc. With the pivot table we can analyze the information extensively and conclude your own observations.
The excel template that contains the developed dynamic table can be downloaded at the following:
DOWNLOAD- SPANISH DYNAMIC TABLE EXERCISE
RELATED POSTS:
Steps to create pivot tables in excel:
- Select all the information that will be included in the pivot table:
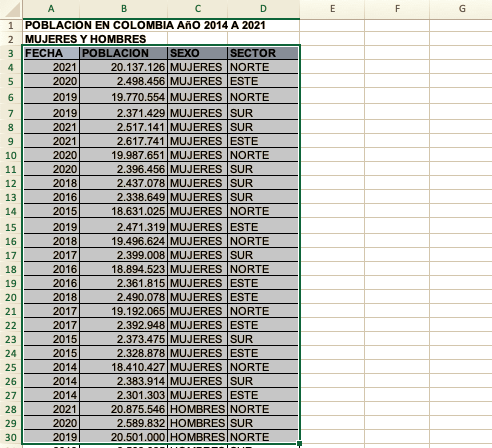
2. Go to the tools menu > Insert > Tables > Pivot Table > a configuration window appears:
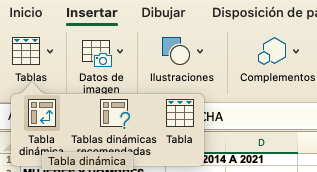
3. In the configuration window you can select a table or range (in this case in step 1 we already selected the information) or you can use an external data source.
4. Select where you want to place the pivot table, it can be in a new spreadsheet within the book you are using or in a Existing spreadsheet > to accept.
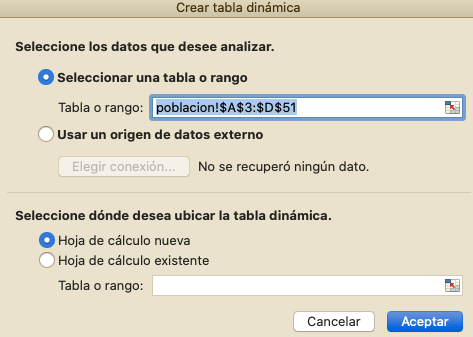
5. Choose the fields of the Pivot table field list and arrange in the boxes. In this case we will organize the information by dragging the fields between the areas as follows:
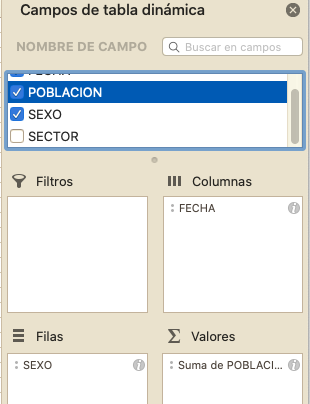
The pivot table will be displayed on the right side like this:

Other Tips when inserting dynamic tables:
You can organize the information in any way you like to discover different ways to analyze the information contained in the pivot table, for example:
By adding the field Sector in the area of FILTERS, you can filter the information to know the population according to the sector of Colombia (North, South, East) and separated by each gender (Man / Woman) throughout the years.
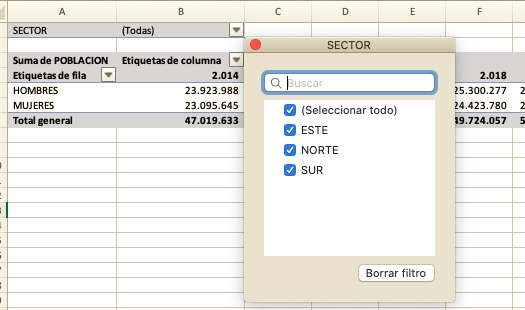
Like this previous example, you can organize the information to obtain the results you want, it will depend on the purpose for which you make the pivot table.
6. To change the design of the dynamic table, two new tools are generated at the top: automate and Acrobat, depending on the excel, select the following symbol >> , here two options are displayed, select Design.
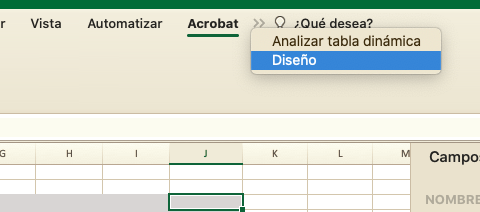
Here you can discover tools such as: subtotals, Grand Totals, Report Layout, Blank Rows, you can also select how you want the colors to be displayed in the table and choose the color. and table layout.

If you want to change the font style, color, size, modify the number format of the values, you can select the cells to modify and do it with the tool Beginning, since there are no limitations of the other tools when creating pivot tables.


